Income History
Back
Why Reveal Income Information
Although Polly would not appreciate my open approach to sharing any "private" family information, I feel the historic perspective of revealing this information has merit. It shows the great Ponzi scheme that the government plays on people with ever increasing prices (inflation) and spiraling wage pressures by spendthrift politicians. It debunks the theory that raising the minimum wage helps people get ahead. It is a cruel hoax. Government spending must be controlled to slow price increases to enable anyone to really get to a better standard of living. Those who read this can decide in future years based on their personal experience.
Year Housing Cost Income Income Ratio to Housing Cost  
1920 $2,000     Hope to find out what household income was in 1920.
1960 $12,600 $7,043 56% Our first house purchase.
1969 $42,700 $25,426 59% Our last house purchase. We were conservative.
2016 $355,000   59% Income of $209,450 would be required to keep the ratio the same.
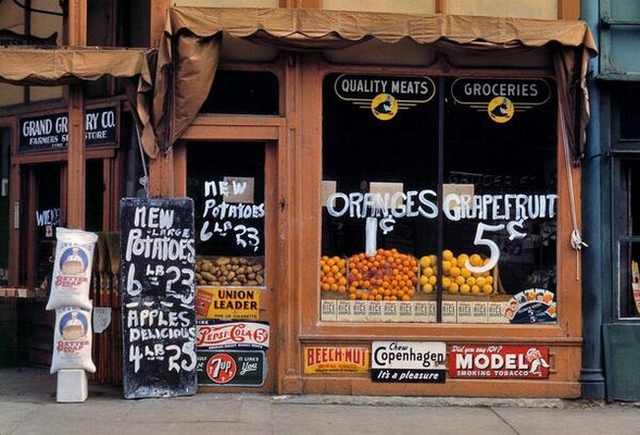
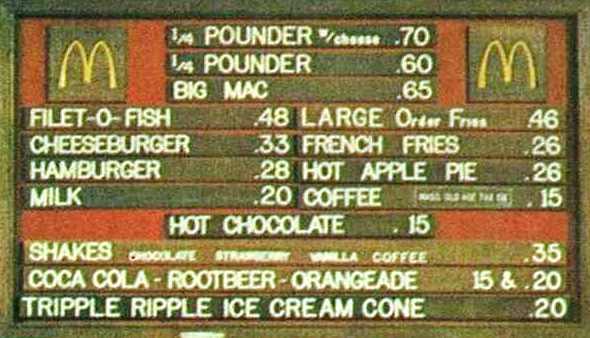
Tom's and Polly's standard of living from 1958 through 2014 was "middle class". I have provided some historic (1940/1949/1932/1934) income and housing cost numbers. These can help you to think about it.
Sample of 1942 Prices Sample of 1970 Prices
Our Income Was A Team Effort
A spreadsheet shows what Polly and Tom earned during their married lives. Even though we earned more and more, we stayed at about the same level regarding a standard of living. We may have had a small incremental improvement in our standard of living from 1958 ($7,128 income) until Polly retired from JC Penney in 2003 ($53,538 income) because we were frugal. No extravagant spending. We saved for our retirement. Polly wisely and diligently invested the money her parents gave her to help us with this as shown by the years when we had dividend and interest income streams. Our income history
©2002 Sales and People Top