| RECESSIONS / DEPRESSIONS |
|
|
|
Started
Mo & Yr |
Ended
Mo & Yr |
Duration |
Peak Unemploy rate |
Decline in Business Activity |
When I was looking for a job. |
| Aug-29 |
Mar-34 |
4 years 7 months |
24.90% |
26.70% |
|
| May-37 |
Jun-38 |
1 year 1 month |
26.40% |
3.40% |
|
| Feb-45 |
Oct-45 |
8 months |
5.20% |
12.70% |
|
| Nov-48 |
Oct-49 |
11 months |
7.90% |
1.70% |
|
| Jul-53 |
May-54 |
10 months |
6.10% |
2.60% |
June 1954 after graduation |
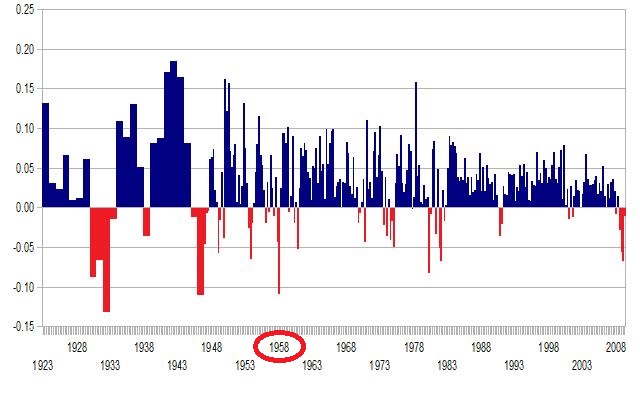
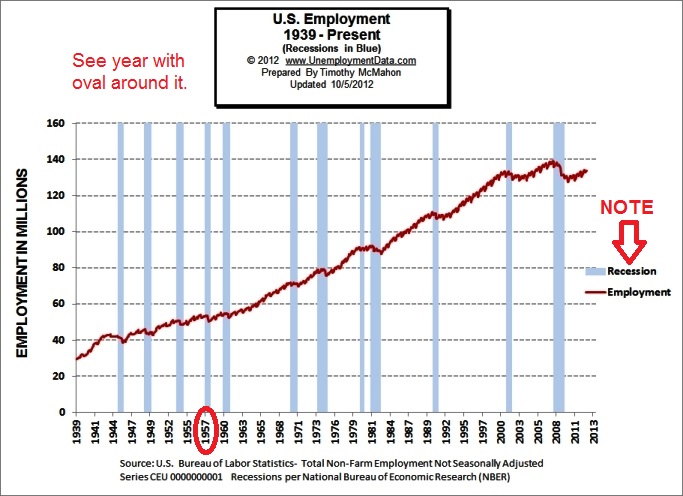
| Aug-57 |
Apr-58 |
8 months |
7.50% |
3.10% |
Sept 1957 after army discharge |
| Apr-60 |
Feb-61 |
10 months |
7.10% |
1.60% |
June 1960 after Mead Johnson |
| Dec-69 |
Nov-70 |
11 months |
6.10% |
0.60% |
Jan 1970 after Huggins |
| Nov-73 |
Mar-75 |
1 year 4 months |
9.00% |
3.20% |
Jan 1974 after Scarborough |
| Jan-80 |
Jul-80 |
6 months |
7.80% |
2.20% |
|
| Jul-81 |
Nov-82 |
1 year 4 months |
10.80% |
2.70% |
|
| Jul-90 |
Mar-91 |
8 months |
7.80% |
1.40% |
|
| Mar-01 |
Nov-01 |
8 months |
6.30% |
0.30% |
|
|
|
|
|
|
|


